Introduction
Mining applications are an up and coming use of UAV technology. A good local application of this in Wisconsin is frac sand mines.One of the most important values that mines are interested in is volume. An easy and very cost effective way to do this is through the use of UAV imagery from which you can calculate volume or in other words conduct volumetric analysis. Using a simple mosiac created from a series of UAV collected images volume can be accurately measured using image processing software. Volume calculations help the mines track how much material they are extracting in tailing piles or piles of the product they are after. They need to keep track of how much frac sand they are extracting and also how much they are moving through the plant in a given amount of time. They also calculate how much material would have to be removed to get to the target product. This is done to determine whether an area is worth the time and money of product extraction. Employee safety is another consideration that make UAVs a more logical choice. Instead of having a survey crew walking down in a mine or throughout the mine where they could be injured by machinery or cave-ins imagery can be collected from a safe distance away from operations. Finally cost, which is probably the biggest advantage of using UAVs is considered. There are other methods of calculating volumetrics including LIDAR and a manual survey team like I mentioned earlier. LIDAR can be very accurate however the price tag to have a mine scanned with LIDAR on a regular basis is just too expensive. Survey crews which usually are made up of 5 to 10 or more individuals are expensive as well and are not nearly as time efficient as UAVs are. In this activity we are focusing on two software programs, Pix4D and ArcMap, to compare the volumetric calculations from each. The UAV collected imagery we are using is from a local aggregate mine just outside of Eau Claire.
Methods
Study Area
The Litchfield Mine is about 5 minutes south of Eau Claire. It is an aggregate mine and the area we are working with is where all of the storage and sales piles are located. Figure 1 is a map of the storage area. For this activity 3 piles throughout the study area were chosen. The piles I choose are outlined in red, orange and yellow.
 |
| Figure 1 This is a map of aerial imagery collected using a UAV of the Litchfield Mine close to Eau Claire. The 3 piles I chose to conduct volumetric analysis on are highlighted. |
Pix4D Volume
The first method used to find volume is using the Pix4D image analysis software. Of all the methods explored this was by far the fastest and easiest to do. See
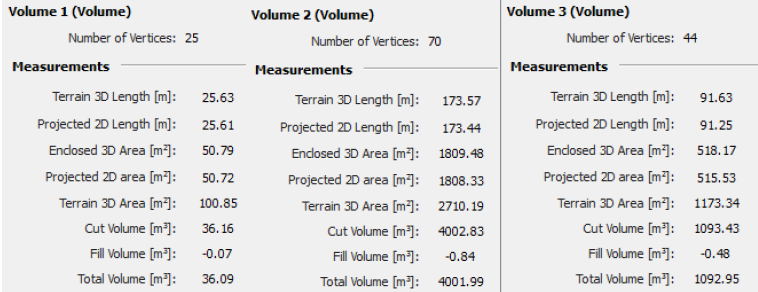
Activity 10 for further information on making measurements in Pix4D. To conduct simple volume measurements in Pix4D you go to the top tool bar and click the volume measurement tool. This will change your cursor to a little green dot. Use your cursor to outline the base of the area you are interested in the volume of. In my case chose 3 different piles to calculate. You can see in Figure 1-3 the green outline of the piles, that is what you are creating in this step. Once you have placed points all the way around the base of the object right click and this will close the shape outline. In the left hand side of the window a picture of the outline you just created will appear as well a box above it with a tab that says calculate values. Click this tab and Pix4D measures the volume of the outlined object. When the calculation is complete the object will turn red (Figure 2-4). The red area is what Pix4D is calculating the volume of. If this doesn't match the area you were trying to measure delete the outline and try again. One the calculation is complete the area over the calculate values tab will fill in with a variety of measurements one of which is volume. This is the value we want. Figure 5 are the resulting calculations for each of the piles I measured.
 |
| Figure 2 This is the first pile I chose to do volumetric calculations on. If you look in Figure 5 this is the measurements under Volume 1 |
 |
| Figure 3 This is pile two. Notice the red cover over the pile in the image on the left and the green outline on the right. All the Xs in the right image are every where I placed a point to outline the pile. In Figure 5 this is Volume 2. |
 |
| Figure 4 This is the final pile I calculated using the same procedure as the first two. In Figure 5 this is Volume 3. |
 |
| Figure 5 This are the measurements Pix4D calculates when an object is outlined using the calculate volume tool. It is nice that many other calculations are included and not just volume in case you need to know area and other measures. |
Raster Volume
Two methods of volume calculation were explored in ArcMap, the first of which is calculating volume from a raster. In order to do this calculation we had to use 3D analyst. The first step is to create a polygon feature for each of the piles you want to find the volume of. These polygons do not have to be tight to the bottom of the pile they can just be a rough outline of the area around the intended pile. Once these are created the extract by mask tool is used to essentially pull the area contained in these new features out of the mosaic raster of the mine. Once this tool is run what you are left with is 3 chunks of the raster each of witch are roughly outlining the piles of interest. Once the 3 pile areas are extracted the next step is to use the identify tool to get the elevation of the area around the base of the pile. When using the identify tool just click anywhere around the base of the pile in the raster clip and a window will open with a pixel value. This pixel value corresponds to elevation. Next using the surface volume tool (Figure 6) I calculated the volume of each pile. Load the raster clip of the pile you want to calculate into the surface box and select a location where a text file with the results will be saved. Next that pixel value you recorded gets put into the plane height box. Leave the other defaults and hit OK. The tool will run giving you the text file output with the pile volume. Figure 7 shows the work flow for this method of volume calculation.
 |
| Figure 6 This is the box to set up the surface volume tool when calculating volume using the raster data set. Notice the plane height value that I set based on the pixel value I collected with identify tool. I did that for all 3 piles. |
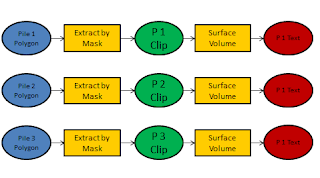 |
| Figure 7 Workflow for the volume calculation using a raster data set in ArcMap |
TIN Volume
The final method I used was calculating the volume using a TIN. A TIN is a Triangulated Irregular Network. The TIN is created by using the raster to TIN tool in ArcMap (Figure 8). Basically what this tool does is based on the raster and a set z tolerance creates a new surface comprised of a bunch of triangles. The TIN allows for 3D surface modelling based on calculated elevations.Figure 9 shows how a TIN surface compares to a raster surface. The more points you choose when creating the TIN from the raster the smoother the TIN surface will be and the less areas you will have where the z tolerance is approached.
 |
| Figure 8 This is the set up box for the raster to TIN tool. You can see the number of points used to create these TINs. To increase accuracy this number can be increased but the tool will take longer to run. |
 |
| Figure 9 This is an illustration showing the difference between a raster surface and the TIN that is created from it. It also shows the z tolerance limit. The more points that are used when creating the TIN the better the green line would match up with the blue line increasing the accuracy of the TIN. |
Once the TIN has been created from the raster the next step is to use the add surface information tool (Figure 10). This tool needs to be run on each TIN and the value that I was most interested in is the z_mean field. This field is used in the volume calculation tool. Once the info tool is run the final step is to run the polygon volume tool (Figure 11). This tool is for TINs only it shouldn't be used on raster data sets. The z_mean field is used in this tool instead of using the identify tool to pull a pixel value like when using rasters. Once the tool has completed the volume will get added to the attribute table of the polygon file associated with each different pile chosen earlier. Figure 12 is the work flow for calculating volume from a TIN.
 |
| Figure 10 This is the surface information tool. This is what you do instead of getting a pixel value like we did with the raster data set. The z_mean is calculated so that it can be used in the polygon volume tool. |
 |
| Figure 11 This is the polygon volume tool used to calculate volume when dealing with a TIN. This is where the z_mean value comes in. It would be selected in the height field box. |
 |
| Figure 12 This is the workflow to calculate volume using a TIN in ArcMap |
Results
 |
| Figure 13 This is the final comparison of the 3 methods of volume calculation |
Looking at the table (Figure 13) the results are obviously not the same for each technique. The Pix4D values are the most accurate of the 3 methods. Pix4D does a much better job of calculating the volume only for the specific object you are interested than the other two methods do. Taking your time to outline the base of the object in Pix4D pays off. Even if you spend a little more time outlining it is still the fastest calculation method by far.
The raster volumes are the closest of the other two methods to the Pix4D values however it is still off by quite a bit. This is most likely due to part of the area around the base of the pile being included in the volume calculation. This explains the elevated values. In my case there must have been quite a bit of the base area included in the calculation because some of the raster values are off by quite a bit.
The TIN values are off by a ton. Again this comes down to the number of points we had the raster to TIN tool use. We used the default amount of 1,500,000 points which was nice for quick processing but we now see that the accuracy is greatly effected by the number of points. In order to try and correct this error as best as possible more points should be added when the raster to TIN tool is run. Again that will make the TIN surface line up more accurately with that of the raster surface. Running the tool with 10 or 15 million points would greatly increase the accuracy but the run time would be increased significantly as well.
This table clearly demonstrates which method gave us the most accurate volumes. Greater attention to detail when using the raster calculation could greatly improve the accuracy of the volume and as stated earlier the number of points needs to be greatly increases to get an accurate volume with the TIN.
Conclusion
This activity examined 3 different methods for calculating volumes using 2 different software packages and a few different techniques. Which method is used for an actual job will be determined by what software and how much computing power is available. Pix4D is super easy to use and very convenient as far as speed of calculations but it costs several thousands of dollars and requires a large amount of computing power. ArcMap is not much better when it comes to computing power needed but it doesn't cost as much. It doesn't have the high level of simplicity that Pix4D does so you really do get what you pay for. If you have the money to get a very user friendly and powerful program like Pix4D it is definitely worth it for increased efficiency and turn around with data analysis. UAVs supply mining companies with an alternative to manual surveying and has potential to streamline operations, cut costs increase safety and potentially give the mine more accurate and more readily available data. It is fascinating where UAV technology can be used and this industry is another perfect fit where UAVs can revolutionize how the industry operates as a whole.


No comments:
Post a Comment